 Housing affordability - costs undermine living standards
From a blog by Lindsay Judge Resolution Foundation
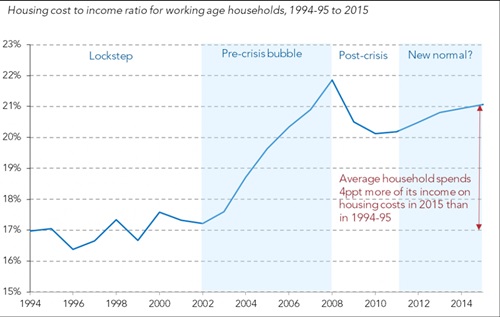
New research by the Resolution Foundation goes beyond the question of house prices and looks at the proportion of household income spent on housing – including rent, mortgage repayments and service charges. It finds housing costs weigh more heavily today – on average households now spend over a fifth of their income on housing, compared to 17 per cent 20 years ago. More households than ever are spending what is widely regarded as too much on housing – 3.2 million spend more than a third of their income on housing.
This upward drift in housing costs has not followed a straight course. We see four distinct phases of housing affordability: the 1990s when housing costs absorbed a low and steady proportion of household income; a rise in the early 2000s when housing costs rapidly outpaced income growth; a post-crisis downturn from 2008 when housing costs fell, driven by low interest rates and falling house prices; and a new period from 2012 when the proportion spent on housing began to rise once more.
The other big housing shift over this period has been changes in housing tenure. Locked out of home ownership by high house prices, a quarter more working age households now live in the private rented sector than in 1994. As well as being the tenure type with the lowest levels of security and quality standards, our research shows it to be the least affordable. Private renter spend an average of 30 per cent of their income on housing, compared to 23 per cent for mortgage owners currently cushioned by low interest rates (but won’t be in the long run). Those in the social rented sector spend around 20 per cent of their income on housing but policy changes may see this figure change substantially over the parliament.
Unsurprisingly, London is the stand-out area of the UK. Households in the capital now spend on average 28 per cent of their income on housing, up a third since 1994. But London isn’t the only area of alarming growth – Scotland and the North West have seen similarly large increases. Indeed, those who thought London was unaffordable 20 years ago should heed the fact the North West is now not far off the level of housing affordability witnessed in the capital in 1994.
Of course, not all households experience the housing costs squeeze equally. Higher income households spend less than a fifth of their incomes on housing today. In contrast, the poorest are paying out a quarter of their incomes for their homes, even when Housing Benefit is taken into account, leaving many with a problematically small amount left to cover other living costs. But it is those in the middle who have felt the squeeze the most, now spending a record 26 per cent of their incomes on housing.
There is little sign that our national obsession with house prices will end any time soon. But housing affordability is a much broader problem than just that. Put into cash terms, the extra income that a typical dual-earning couple with a child pays out today for housing compared to 1994 is equivalent to a 10p rise in the basic rate of tax. That’s a lot of money. Small wonder then that housing costs risk undermining the living standards of many, and look set to dominate our national and regional agenda for some time to come.
Download report here
Retweet about this article:
Lindsay Judge - Resolution Foundation, 24/05/2016